
The falling cost of renewable energy is cause for celebration and much needed optimism in the fight against climate change. However, as project costs have fallen and governments have adjusted their approach to project procurement, competition has risen. This is putting returns under pressure for private equity investors in infrastructure projects. Indeed, the average return in emerging and frontier market renewable energy private equity investments has been falling steadily for about a decade. But the same is not true for the credit portion of infrastructure project finance.
Where is the pressure on equity coming from, why is credit less affected, and where are the best opportunities?
The roll-out of renewable energy in emerging markets has increased rapidly over the last decade. During that time, the cost of installing the infrastructure, and consequently the cost of producing power from it, have declined materially. The impact of the renewable energy programmes across Africa has been significant. In South Africa, the energy mix in 2010 consisted of 85% coal fired power generation and 4.9% renewables. Today this mix has changed to 74% coal with the renewables portion now more than three times higher, at around 16%. Furthermore, the South African Minister of Energy, in October 2021, announced the winners of the fifth round of the renewable energy auction process. This will add a further 2,583 MW of clean energy to the grid*.
Table 1: Energy capacity by source, South Africa (megawatt hours, or “MW”)**

Source: Eskom Annual Integrated Report, 2010 and Eskom Annual Integrated Report 2020.
In Asia, similar trends are under way. In the year 2000, the region had circa 157GW of renewable energy installed capacity, 95% of which was generated by large hydropower plants. By 2018, installed renewable energy capacity had grown to 988.9GW, 51% of which was generated from solar photovoltaic (PV) and wind power plants.
Pressure on costs and equity returns
As these renewables markets have matured, capital costs have been falling and the unit cost per kilowatt hour of renewable energy – the tariff – has generally declined. Developers have been able to leverage economies of scale, negotiate improved terms from suppliers, and apply financial structuring to achieve low tariffs. By way of example, over the last 10 years the wind tariff in South Africa has reduced by around circa 37% and the solar PV tariff by circa 70%, in local currency terms. Indeed, South Africa has now scrapped tariff caps in its auction process, given the competitiveness of the market. In the aforementioned fifth renewable energy procurement round, South Africa achieved record low tariffs, with a weighted average price range of just USD 2.7-3.1cents per/kWh (across wind and solar PV). A major outcome of the market’s maturation and competitiveness has been its rising autonomy. This has meant auction processes are being overhauled in a growing number of emerging markets.
- South Africa, Egypt and Morocco have implemented significant renewable energy procurement programmes run via “open tender” processes.
- The International Finance Corporation has formulated and implemented an auction process called “Scaling Solar” in conjunction with the governments of Zambia, Senegal and Ethiopia, among others. The programme seeks to reduce the procurement risk and implementation risks for both governments and independent power producers (IPP’s) when procuring solar PV capacity.
- Lastly, many governments have rolled out their own auction processes to increase participation by IPPs, resulting in installed capacity and generation mix shifting in many other African countries too.
Renewable energy auctions have also become popular in Asia, with some countries dispensing with feed-in-tariff programmes in favour of auctions. The Philippines, Malaysia, Thailand and Vietnam are relative newcomers to the renewable energy auction process, while the likes of India continue to run multiple auctions each year.
Table 2: Renewable energy auction capacity results in India, 2012-2020***
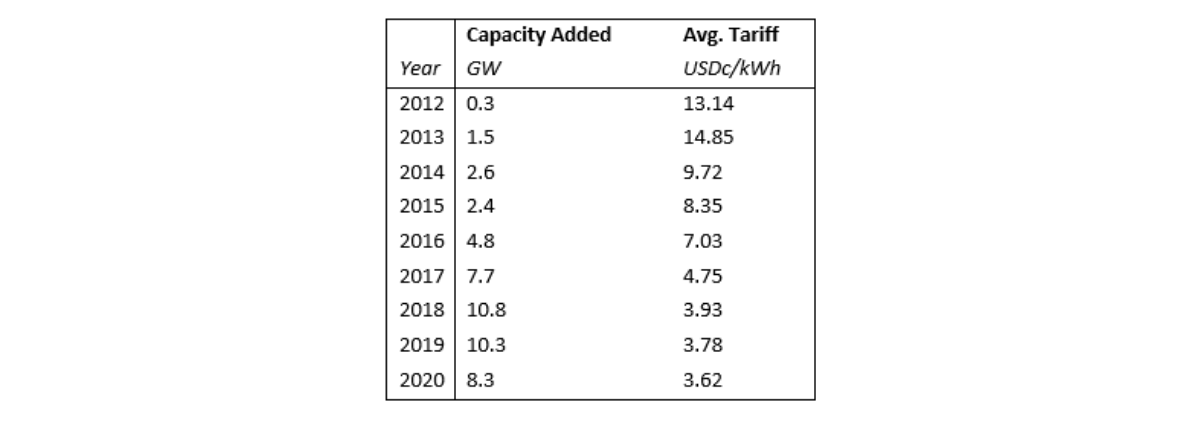
Source: India PV auction results, 2012-2020 – Charts – Data & Statistics – IEA
As discussed, the progress is positive in its implications for the goals of 2015 Paris Agreement, but has squeezed equity returns for investors. To tackle the problem, some investors have taken on development risk. For large utility-like developers and investors, their vertically integrated structures (procurement, operations and maintenance services, management services etc.), help with diversifying risk and increasing effective returns. Some developers though, make aggressive assumptions on the key project inputs which may not materialise. This can stack a project with additional risk and increase the likelihood of forecast equity return not being achieved.
Opportunities in debt
The debt market, meanwhile, has not been exposed to the same level of contraction. Senior infrastructure debt spreads in the emerging markets range between 400-650 basis points (bps) over the base rate. This represents a premium of circa 200-400 basis points over senior infrastructure debt in the developed markets. Emerging market mezzanine infrastructure debt follows a similar pattern. Spreads of between 600-1,000 bps over the base rate – around 200-400 basis points over the equivalent instrument in developed markets – are not uncommon.**** In contrast, the loss rates in emerging markets ranges from 1.3%-2.2%, compared to developed markets rates in the range of 0.9%-1.7%. Emerging market infrastructure debt offers a material premium over the developed markets, but with a similar or marginally greater risk profile.
On balance, we believe debt is more appealing
Overall, we believe this backdrop means investing in the emerging markets renewable energy sector via debt delivers a more appropriate risk-adjusted return for our investors, currently. Being a debt provider offers priority in the capital structure, security over assets, corporate guarantees, among other things, which contribute towards reducing the risk profile of the investment. The additional 200-400 basis point spread achievable in the emerging markets, whilst taking similar or marginally higher risk than similar investments in the development markets, supports this strategy.
Notes
* Announcement by the Minister of Mineral Resources and Energy, 28 October 2021, www.ipp-renewables.co.za
** Eskom Annual Integrated Report, 2010 and Eskom Annual Integrated Report 2020
*** Table: 2020 data represents January to August 2020
**** Mercer 2018, infrastructure debt spreads
– ends-
For further information, please contact:
Tahmina Theis
+41 44 441 55 50
tahmina.theis@blueorchard.com
Disclaimer
The information in this publication was produced by BlueOrchard Finance Ltd (“BOF”) to the best of its present knowledge and belief. However, all data and financial information provided is on an unaudited and “as is” basis. The opinions expressed in this publication are those of BOF and its employees and are subject to change at any time without notice. BOF provides no guarantee with regard to the accuracy and completeness of the content in this publication. BOF does not in any way ascertain that the statements concerning future developments will be correct. BOF does not under any circumstance accept liability for any losses or damages which may arise from making use of, or relying upon any information, content or opinion provided by BOF in this publication. This publication is provided for marketing reasons and is not to be seen as investment research. As such it is not prepared pursuant legal requirements established for the promotion of independent investment research nor subject to any prohibition on dealing ahead of the distribution of investment research. This publication may contain information, references or links to other publications and websites from external sources. BOF has not reviewed such other publications and websites. BOF in particular does neither guarantee that such information is complete, accurate and up-to-date nor is BOF responsible in any way in relation to the content of such publications and websites. The information in this publication is the sole property of BOF unless otherwise noted, and may not be reproduced in full or in part without the express prior written consent of BOF. All investments involve risk. We note specifically that past performance is not an indication of future results. Emerging markets impact investments involve a unique and substantial level of risk that is critical to understand before engaging in any prospective relationship with BOF and its various managed funds. Investments in emerging markets, particularly those involving foreign currencies, may present significant additional risk and in all cases the risks implicated in this disclaimer include the risk of loss of invested capital. To understand specific risks of an investment, please refer to the currently valid legal investment documentation. The materials provided in this publication are for informational purposes only and nothing in this publication can be construed as constituting any offer to purchase any product, or a recommendation/solicitation or other inducement to buy or sell any financial instrument of any kind and shall not under any circumstances be construed as absolving any reader of this publication of his/her responsibility for making an independent evaluation of the risks and potential rewards of any financial transaction. We note in particular that none of the investment products referred to in this publication constitute securities registered under the Securities Act of 1933 (of the United States of America) and BOF and its managed/advised funds are materially limited in their capacity to sell any financial products of any kind in the United States. No investment product referenced in this publication may be publicly offered for sale in the United States and nothing in this publication shall be construed under any circumstances as a solicitation of a US Person (as defined in applicable law/regulation) to purchase any BOF investment product. The information provided in this publication is intended for review and receipt only by those persons who are qualified (in accordance with applicable legal/regulatory definitions) in their respective place of residence and/or business to view it, and the information is not intended under any circumstances to be provided to any person who is not legally eligible to receive it. Any recipient of information from this publication who wishes to engage with BOF in furtherance of any transaction or any relationship whatsoever must consult his/her own tax, legal and investment professionals to determine whether such relationship and/or transaction is suitable. By no means is the information provided in this document aimed at persons who are residents of any country where the product mentioned herein is not registered or approved for sale or marketing or in which dissemination of such information is not permitted. Persons who are not qualified to obtain such publication are kindly requested to discard it or return it to the sender. BOF disclaims all liability for any direct or indirect damages and/or costs that may arise from the use of (whether such use is proper or improper), or access to, this publication (or the inability to access this publication). BOF has outsourced the provision of IT services (operation of data centers, data storage, etc.) to Schroders group companies in Switzerland and abroad. A sub-delegation to third parties including cloud-computing service providers is possible. The regulatory bodies and the audit company took notice of the outsourcing and the data protection and regulatory requirements are observed.
Copyright © 2022, BlueOrchard Finance Ltd. All rights reserved.